Pedagogic challenges 2: urban systems science
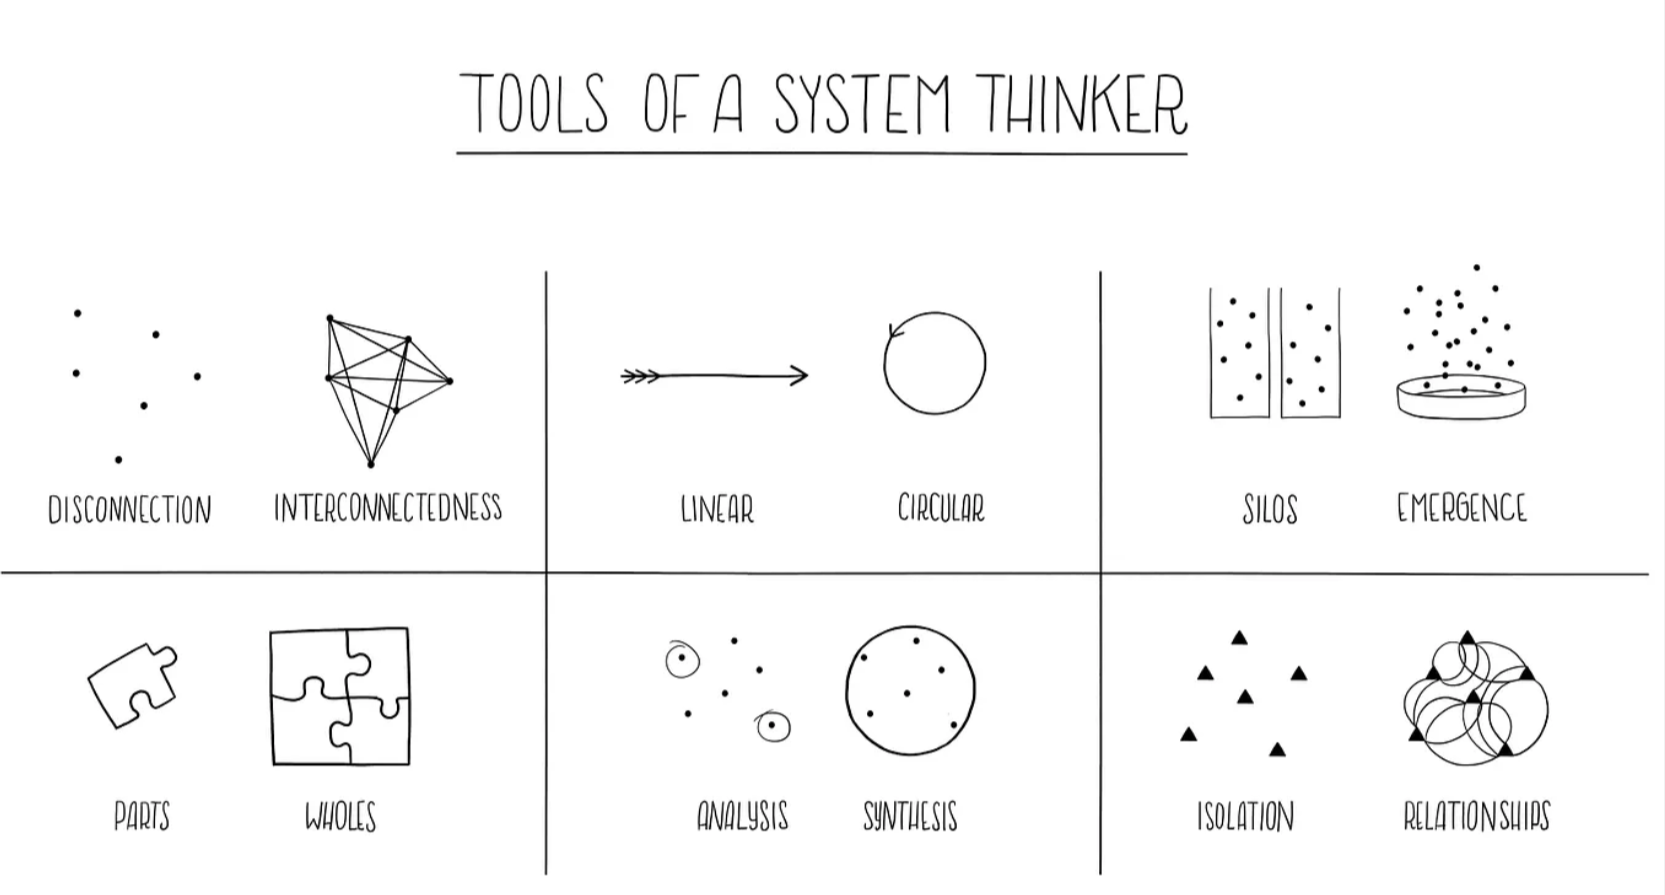
Urban system science approach:
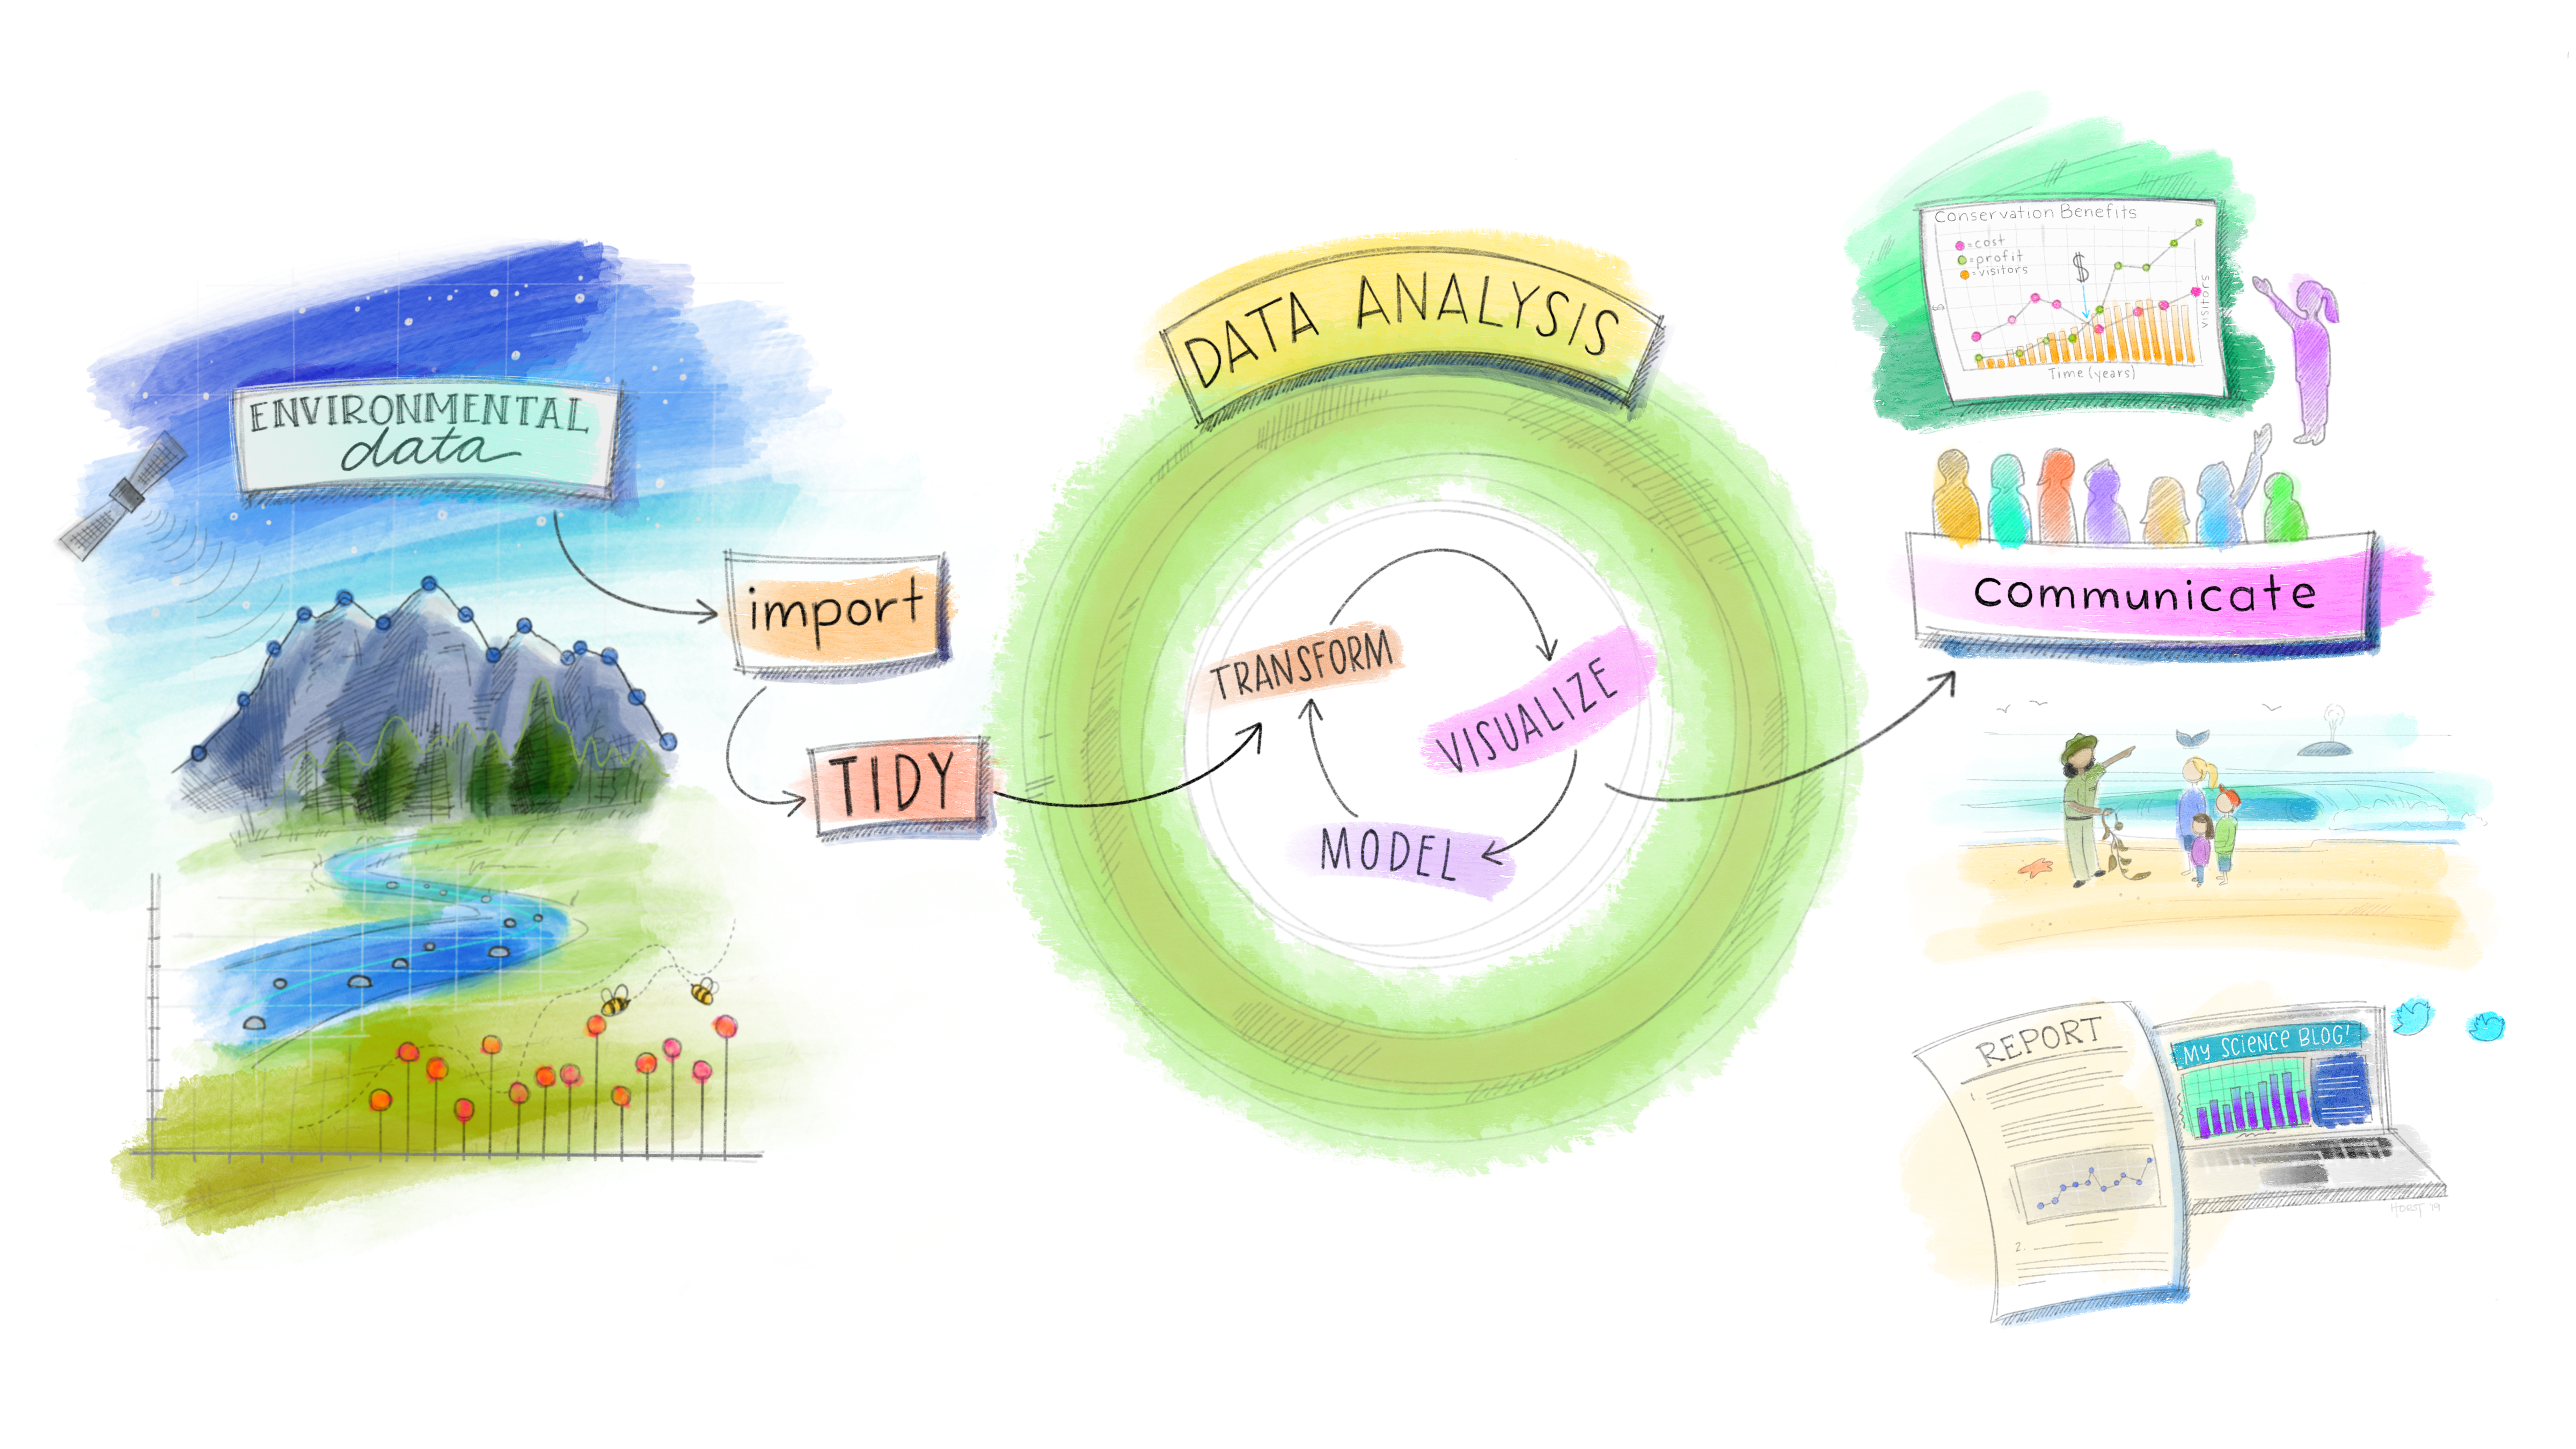
The same as regular data science but with spatial data
An example..Urban Heat Island effect
Fremantle Woolstore, Western Australia


An example….UHI

An example….UHI
Ran 4 scenarios:
- Original (existing) development (from satellite imagery)
- Proposed redevelopment as in the plan
- Proposed redevelopment removing trees
- Proposed redevelopment with trees covering the hottest pixels

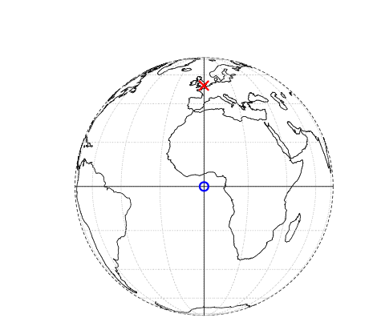
What is spatial data?
- The earth is a 3D sphere (well, almost). It’s wider than it is tall
- In order to locate a point on the surface of a sphere, we need a set of coordinates
- Coordinates will tell us how near to the top or bottom of the sphere we are, or how far around
- But where do we start?

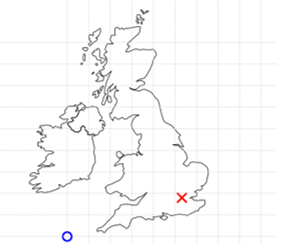
What is spatial data 2?
Geographic Coordinate Reference System
- treats the globe as if it was a sphere divided into 360 equal parts called degrees
Projected Coordinate Reference System
- flat, two-dimensional plane (through projecting a spheroid onto a 2D surface) giving it constant lengths, angles and areas

Simply
Spatial data is just like normal data except it has an extra “geometry column”

Data contamination / manipulation

Who has made our boundary data?
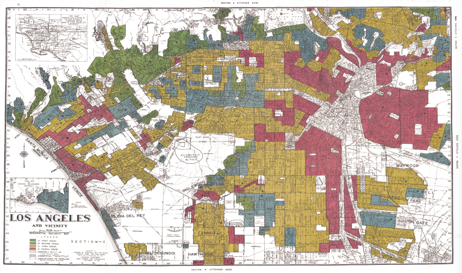
Redlining
- 1930s – American Home Owner’s Loan Corporation – prevent missed payments…residential security maps based on race
- People abandon areas
- Can’t refinance
- Less property tax for services
- Social equity issues remain
- 1968 Fair Housing Act
Who has made our boundary data?
Gerrymandering
Every 10 years electoral districts are re-drawn “redistricting”– Thomas Hofeller (republican) = PACK and CRACK
- PACK = put all the democrat voters in 1 district
- CRACK = sprinkle them out so they never have majority
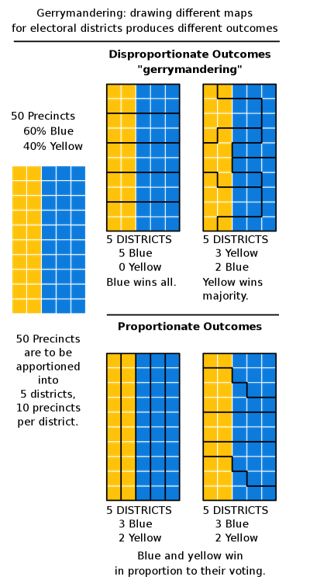

“Redistricting is democracy at work” - Tom Hofeller


What can we do about it?
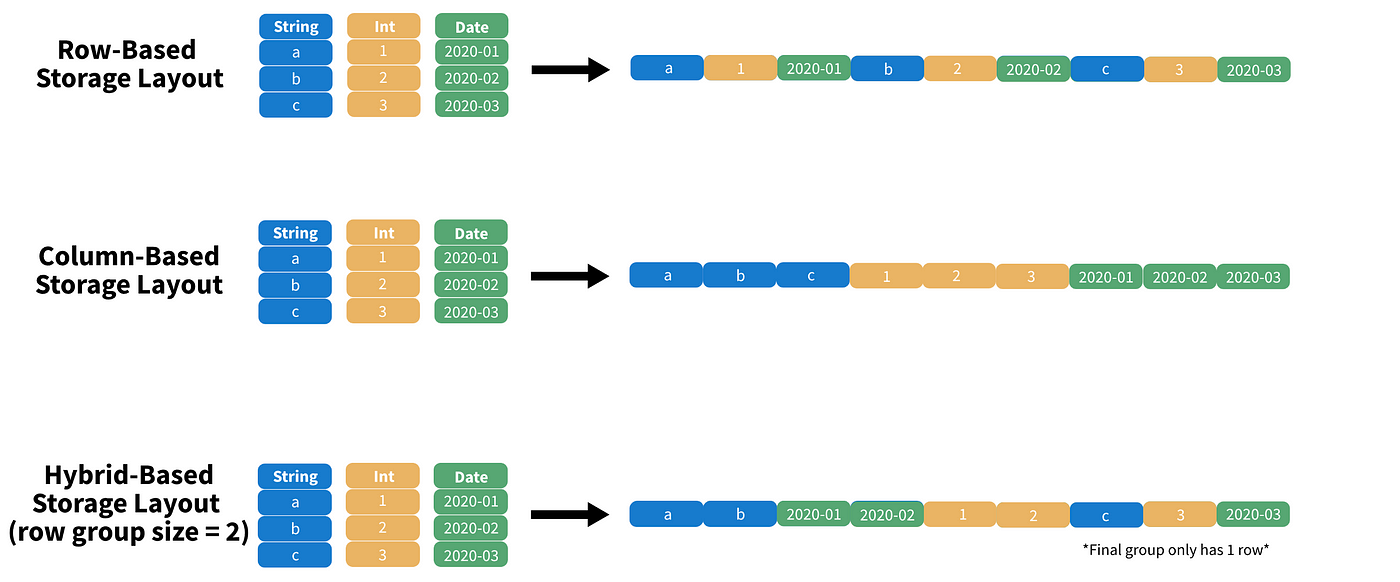
Parquet files
We are moving from row based storage to column based
About 50x faster than a .csv
It groups our data.
For example a row group size of 2, puts rows all the data from 1 and 2 next to each other then we have 3! = GROUPS or PARTITION
If we have large data this means we can skip groups we don’t need
![]()
We can go faster!

Postgres

Postgres = object-relational database
This allows the “geometry” column and spatial quieres
Making random points in polygons

5 million random points
- QGIS = 226 seconds
- PostGIS = 18 seconds
PostGIS
![]()
Starting
Despite all these tools we must start with the basics.
Often this is in Quantum GIS (free) or ArcMap($)
We will be exploring QGIS in the workshop later

What led me here?
- Lecture with Carl Howe
2017, 90% of the data in the world today has been created in the last two years alone, at 2.5 quintillion bytes of data a day! - IBM

1. Lead by example
Traditional labs and were distributed in pdfs, word documents and powerpoints.
Used ArcGIS 💰
![]()

1b. Listen to Alumni / employers


2. Make it mandatory for the assessment
Students
Click the URL and generates a new repository
Staff can see their work and when they make edits (commit / push)

Conclusion
It is essential to use data to inform decisions…BUT we must develop a critical awareness of:
- How the data has been created
- How the boundary data has been created
- What the agenda was for collecting the data
In addition we must recognize that:
- Data is a snapshot / sample of the population
- Analysis attempts to model the world - it is never perfect.
Scientists must have a say in the future of cities, McPhearson 2016
![]()